Keeping ahead of the trends: understanding risk in a changing climate

Richard Dixon PhD
Head of Catastrophe Research
The climate is changing: that much we know. Those of us in the United Kingdom may have noticed that the frequency of snowfall in winter has dropped in the past thirty to forty years, or that we tend to get hot spells more frequently. But what are the challenges when we start to consider the less frequent events that reinsurers are interested in?
The chart below shows the frequency of heatwaves (defined here arbitrarily as 5 or more days above 27C) from Berkeley reanalysis data for a location at 51N, 0W: essentially somewhere close to London.
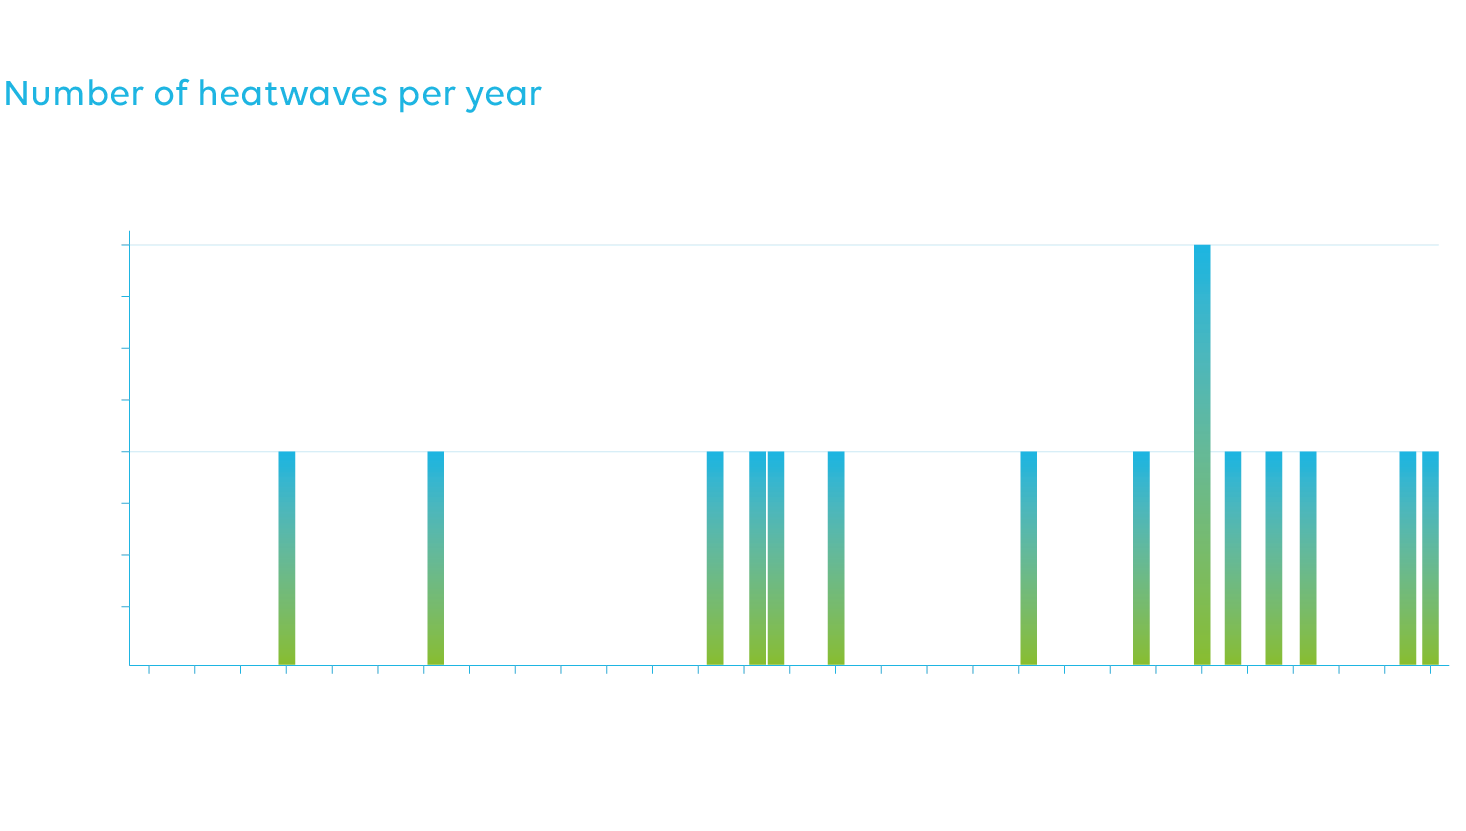
To the eye, we can see that whilst we’ve had heatwaves in the past (the 1976 heatwave is often referred to as a benchmark and 1911 is noted as well for the length of warm spell), we can see seemingly more and more heatwaves in the present day, especially after around 1990. We can summarise this alternatively by looking at the return period of heatwaves in the prior 50 years’ worth of data and see how frequent the heatwaves were in this data:
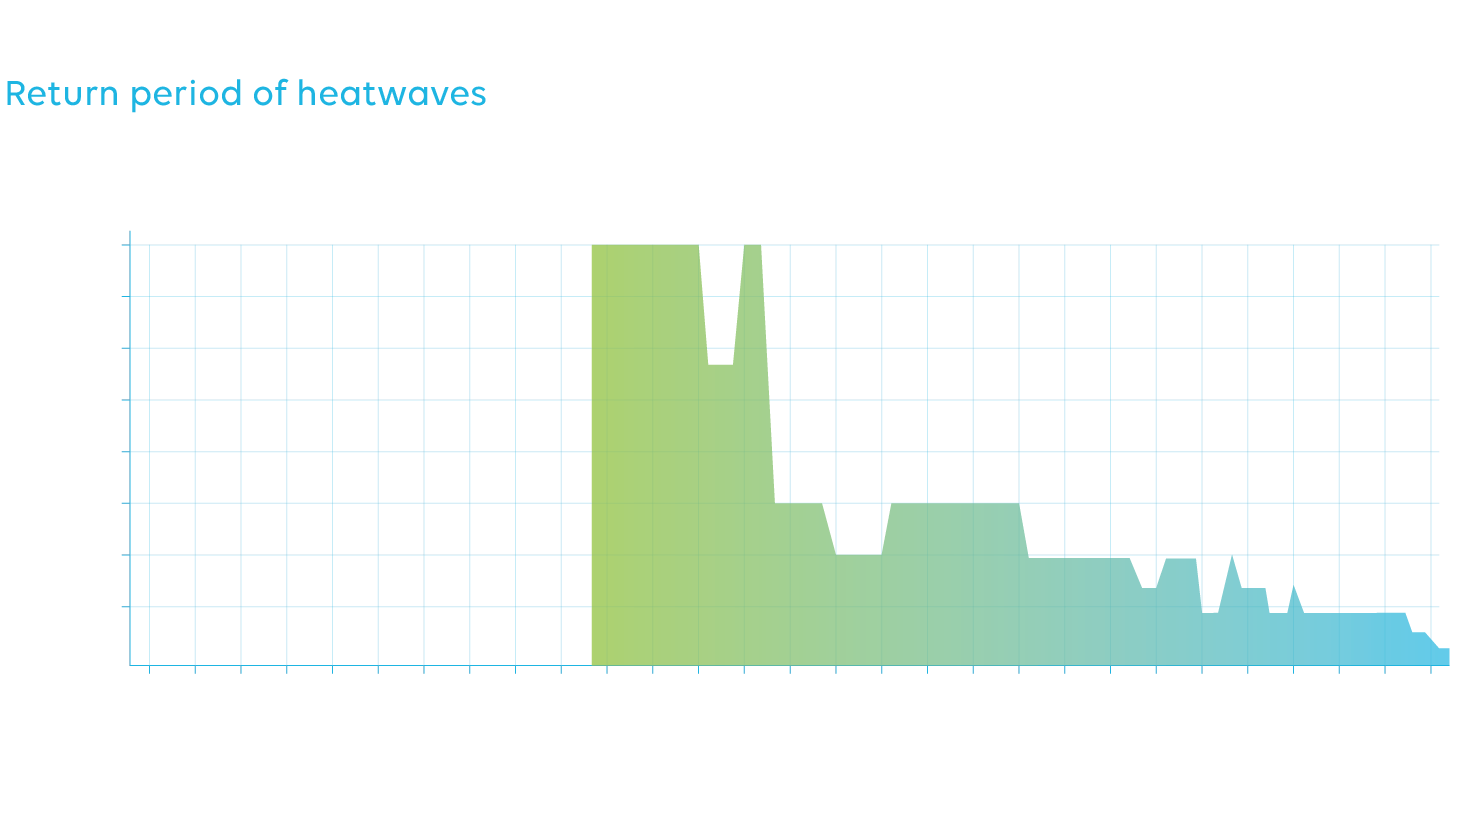
In simplest terms, we can see how the return period of heatwaves has dropped markedly from around 1-in-12 years in 1950 to about 1-in-6 by 2025. But what are the chances that we’re able to spot a shift in an event that changes from a 12-year event to a 6-year event from 1950 to 2025?
We can do a simple test here where we say that a heatwave in 1950 has a 1-in-12 chance of happening in that year that gradually becomes a 1-in-6 chance by 2025. Is a change in heatwaves easy to spot? What we’ve done is run our experiment 10,000 times – essentially re-running history 10,000 times – and looked to see if there is an increasing trend in heatwaves in keeping with the underlying shift from 12- to 6-year return periods:
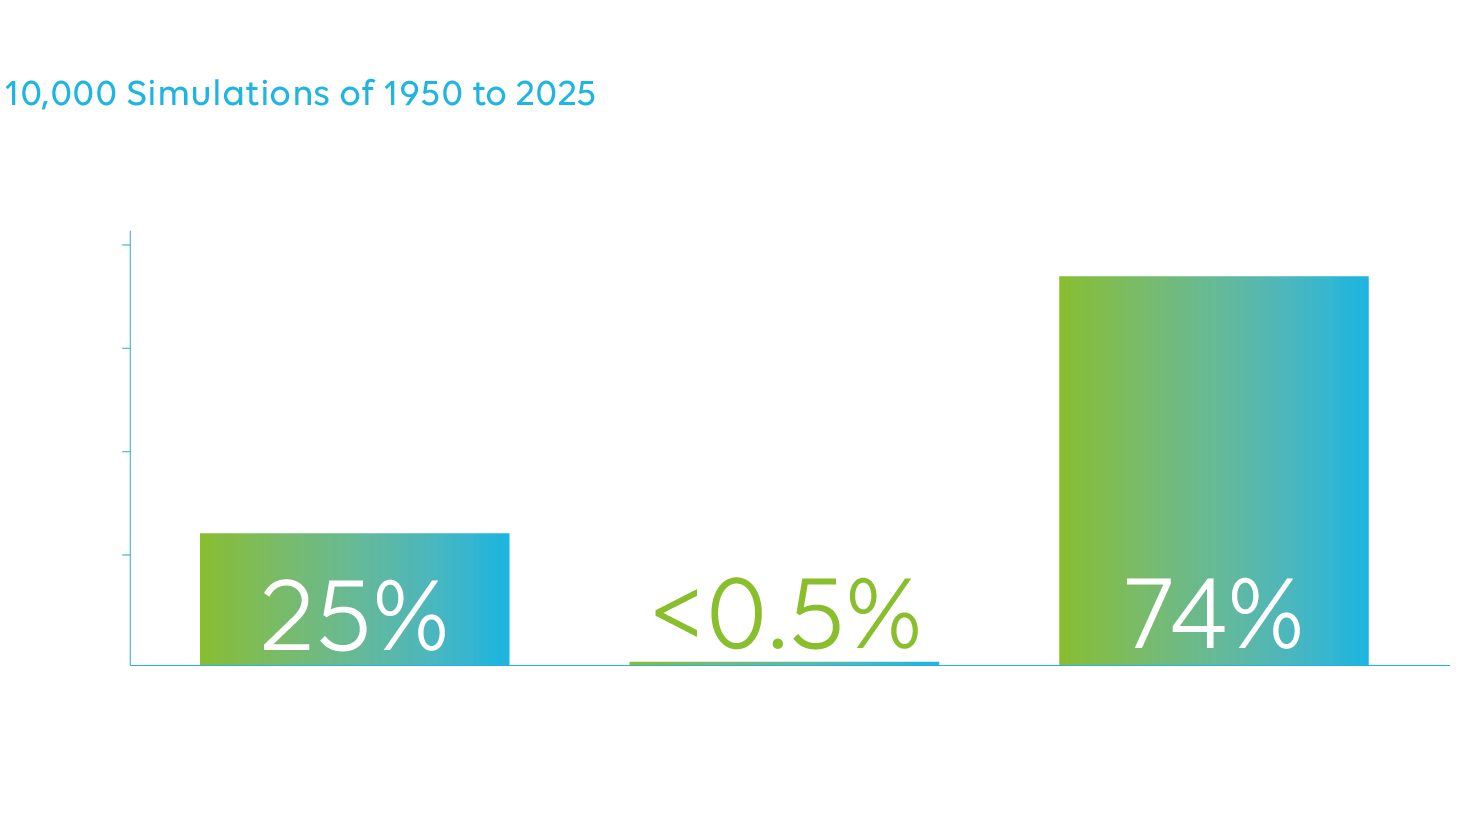
We can see that around 75% of the time, we should be able to spot an increase in the frequency of heatwaves. So, when events that are fairly frequent start happening more frequently, it’s often evident to us or “spottable” in data owing to their frequency.
Now, if we switch to the world of insurance and reinsurance, we’re often wary of events on the “once-in-a-lifetime” timescale that occur. What if the frequency of these events is changing as well? Can we spot the shift much like we’re likely able to spot the shift in heatwaves?
Let’s assume that our once-in-a-lifetime event has the return period of 1-in-100 years: the sort of return period that’s typical of middle-to-upper layer reinsurance programmes. What if – like the heatwaves – this is becoming twice as frequent, and from it being a 100-year event in 1950, we’re seeing this maybe once every 50 years in 2025.
So, let’s do our same experiment again: this time with a 1-in-100 chance in 1950 becoming a 1-in-50 chance by 2025. Can we spot the shift in these longer return period events from 1950 to 2025?
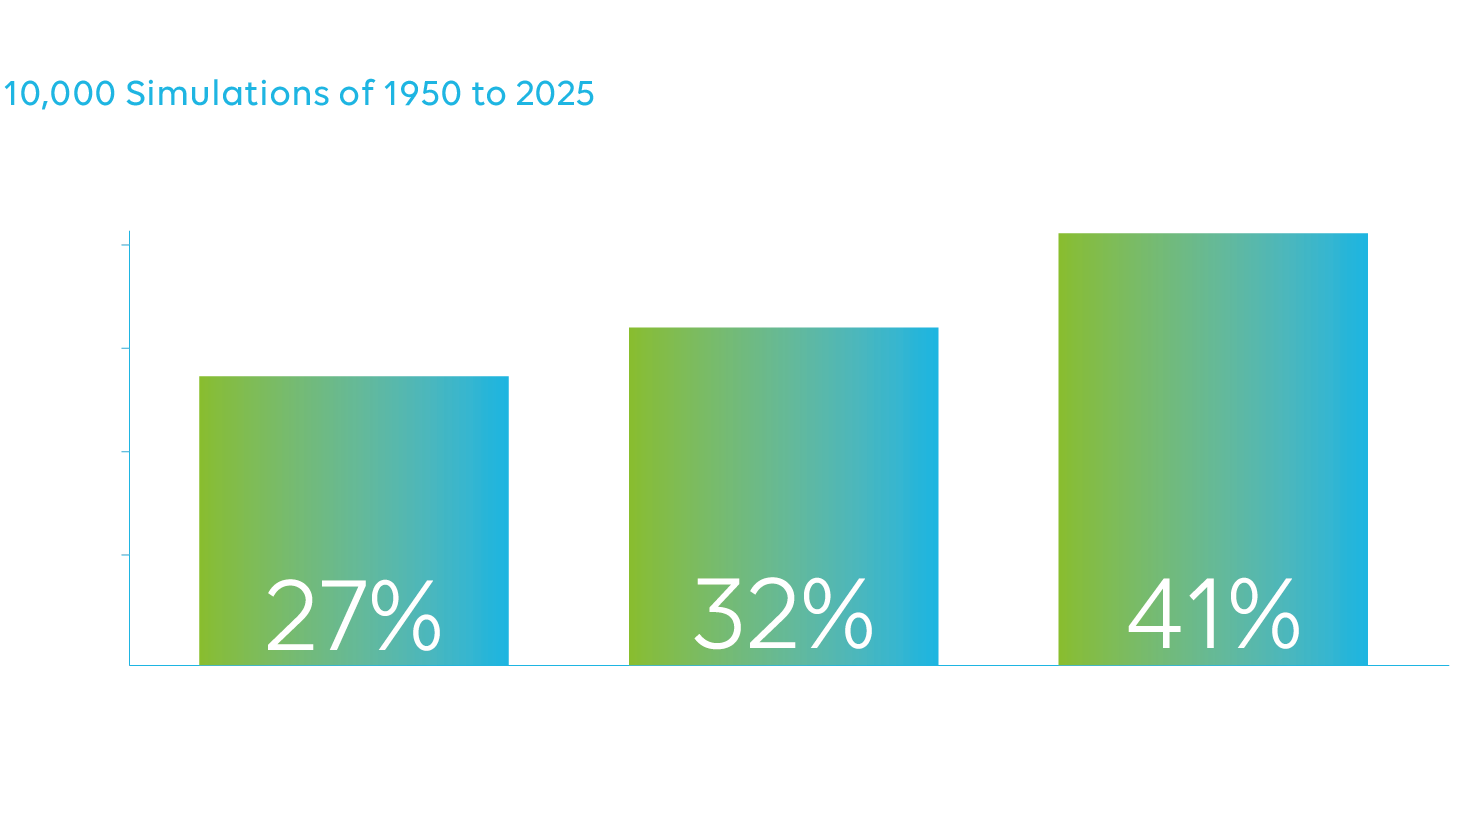
Now we see a different result. Only around 40% of the time can we spot an upward shift in the risk. There is a doubling of the risk, but it’s at much longer return periods: both a 100-year and 50-year events are pretty rare and this is evidenced by the fact that there’s a 1-in-3 chance that you simply don’t see any events in our 1950-2025. So the risk essentially appears as though it is not changing. Indeed the rarity of this risk – even though it’s doubling – can also give the impression around a quarter of the time that the risk is decreasing!
It’s this that is potentially the most dangerous aspect of relying on historical data: when risk is changing, but the risk is rare across the period of interest, we may not have any signals it’s changing. As takers of risk, it’s becoming increasingly important to make sure we don’t take history at face value and to seek other ways that look beyond historical data to understand present-day risk.
The ability to adjust for shifts in both frequency and severity are paramount in building out a present-day view of risk that accounts for changes that might have happened: even if they are not in plain sight. Therefore, part of the build-out of OAK Re’s internal risk systems has been to ensure that shifts in both frequency and severity of perils are catered for at the point of underwriting.
Given that historical data alone can be an unreliable guide, it’s fortunate that more and more work is being done by researchers to effectively simulate history multiple times in climate models to help us understand how risk might be changing. The more we can invest in and partner with this pioneering research, the better informed we will become as an industry.
Richard Dixon
Richard has 25 years of experience in the insurance industry building, researching and evaluating catastrophe models. He has a specific interest in understanding whether and how climate change is reshaping catastrophe risk, challenging conventional assumptions and developing new approaches to risk assessment. He has been a Visiting Research Fellow at Department of Meteorology at the University of Reading for the past 7 years and is a Fellow of the Royal Meteorological Society.