Hurricane Forecasts: A Useful Guide for Loss Estimation?

Richard Dixon PhD
Head of Catastrophe Research
Richard Dixon PhD
Head of Catastrophe Research
Those slightly older in the tooth might remember the 2010 hurricane season: the seas were forecast to be warm for the summer, and La Niña was also on the cards. Both came off, but insurers breathed a sigh of relief despite the forecast of a busy season, no hurricanes made landfall. A season like 2010 with 19 storms in the basin – 12 of which that became hurricane-strength – and very low impacts for insurers: are hurricane forecasts useful at all when it comes to insurance losses?
The forecasts for 2010 season were broadly very good: with June’s forecast numbers at 17-20 storms from the (then) five forecasting agencies. Let’s imagine we live in a world where the forecasts for tropical storm numbers in the Atlantic are perfect: the forecast is exactly the same as the activity that season. Would a perfect forecast help in understanding the possible loss outcome?
When it comes to understanding actual losses, we need more than just an active storm in the basin: they clearly need to make landfall in the US to cause losses. Since 1980, we’ve had 612 storms in the basin; 70 of those made landfall at hurricane strength. So, we simulate possible losses for each year since 1980 using the actual historical number of storms in the basin and for each storm in each year, we simulate an 11% percent chance of each storm making landfall. If one of our simulated storms does make landfall, we pick a random landfalling hurricane event from a catastrophe model and use the loss from this event.
For a single simulation of the 44 years from 1980-2024, the below charts show:
For a single simulation of the 44 years from 1980-2024, the below charts show:
Left: The number of tropical storms vs the landfalling hurricanes
Right: The number of tropical storms vs the resultant seasonal losses
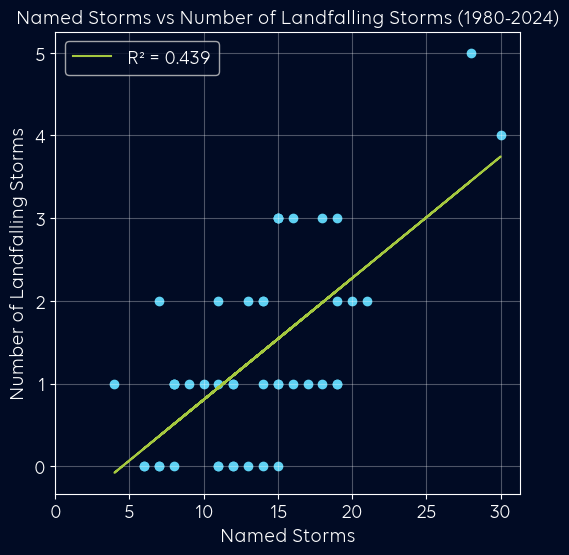
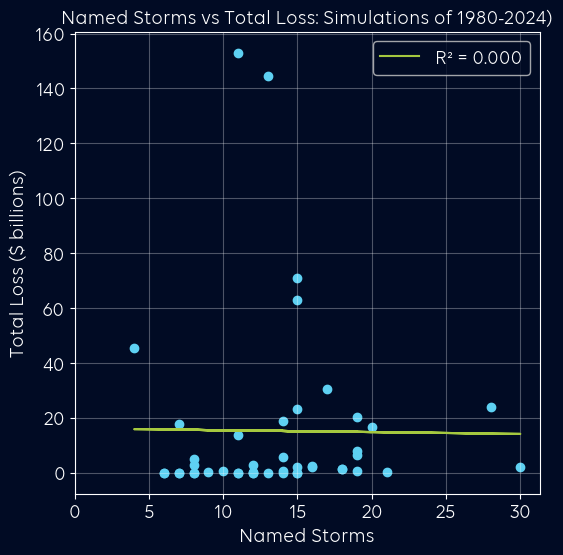
From the tropical storms vs. landfalling hurricanes chart on the left, we can clearly see that we’ve imposed a relationship between the tropical storms in the basin with 11% becoming a landfalling hurricane. So broadly, we see that as the number of storms in the basin increase, so do the number of landfalls. It’s not perfect, but there is a relationship. However, the relationship between the number of tropical storms in the basin and the loss at landfall – in the right chart – is much looser than the basin vs landfalling hurricanes statistics.
In our example, even using the actual number of tropical storms each year as if the forecast was perfect, we can’t expect them necessarily to be a strong guide for what losses to expect. Little wonder when looking at the right-hand chart, we can see why people might roll their eyes about hurricane forecast utility for insurers: even our “perfect” hurricane forecasts are seemingly hopeless for predicting losses!
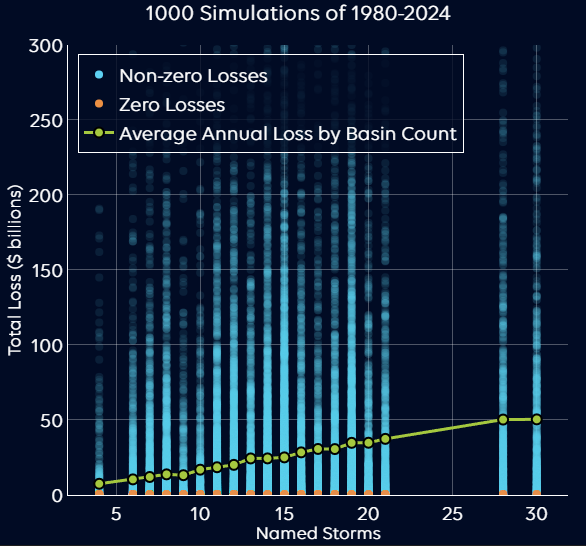
However, we can look at the 1980-2024 simulations in more detail. Let’s repeat the above study. In fact, let’s repeat it a thousand times. The chart below plots all the data, while showing the average annual loss as a function of the number of the storms in the basin: you can hover over the green line to see how the Average Annual Loss moves as a function of the Basin Count.
The chart below plots all the data, while showing the average annual loss as a function of the number of the storms in the basin: if you’re reading this on a web-browser, you can hover over the green line to see how the Average Annual Loss moves as a function of the Basin Count.
Despite all the noise, there is a trend because – at least based on our knowledge of historical data that is imposed in this simulation – 11% of storms that form in the basin make landfall as a Cat 1 hurricane or greater. The more storms in the basin, the more landfalling storms you get, resulting in higher average annual loss. It is also worth pointing out that irrespective of the number of storms in the basin, using the simple 11% landfall rule, you can still zero loss years (the orange dots) if you’re lucky with landfalls.
This type of result is quite common in catastrophe data: a lot of noise, with some underlying trends. As the right-hand previous chart showed, if you pick individual 45-year simulations, you might see a lot of noise: we can see how history is quite adept at hiding trends.
We can take this one step further by comparing the years with 14 storms in the basin – just about average – to the years with 28 storms in the basin – a “hyperactive season” – and contrasting them with histograms of the likely loss:
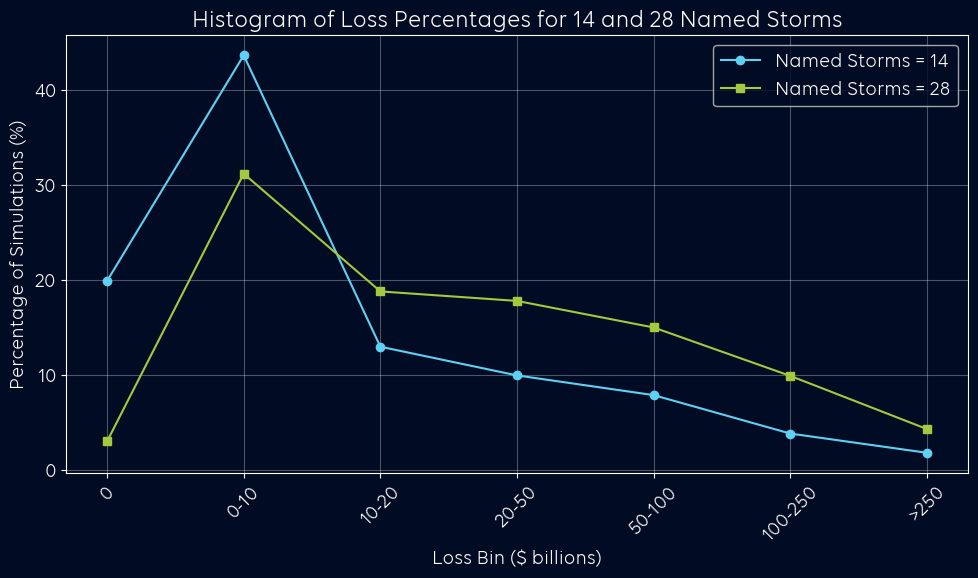
What is fairly evident is how for the years with 28 named storms, we’re broadly seeing double the chance of losses in the tail. We also note that we can see how the chance of there being NO loss is markedly different – with 19% of years where there are 14 basin-wide storms having zero loss but only a 3% chance when there are 28 named storms.
As we’ve alluded to above, the danger for us however is from drawing conclusions from single years in isolation that may have been unlucky or lucky from a loss standpoint. Let’s say we pick individual years with 14 and 28 storms in the basin at random: it is relatively easy for the quieter 14-storm year to end up with more loss than the 28-storm year. This is because
- Only a certain proportion of storms in the basin will make landfall
- Upon landfall, insurance exposure is quite random, meaning the same strength of storm can lead to anything from millions to tens of billions of loss or more
Interestingly, 30% of the time, a 14-storm season will result in a higher loss than a 28-storm season, which could be a reason why hurricane forecasts are potentially taken with a pinch of salt in our industry. It’s down to the individual whether you see this as simply too much noise to find the information useful.
Very simply: the fewer the data points, the more difficult it is to find a trend, and often in catastrophe modelling, it’s quite necessary to look beyond the historical data (or in this case, simulations of historical data) to be able to understand the issue better.
However, there is an elephant in the room: landfalling behaviour. This example assumes that the chance of a tropical storm making landfall as a hurricane is static. This is an area of research that is fairly sparse in academic literature whilst being fairly core to our understanding of risk, especially in a changing climate.
In a follow-up next month, we will be looking into this topic with Reask, with whom we have entered a multi-year partnership to understand global cyclone risk. Watch this space…
Richard Dixon
Richard has 25 years of experience in the insurance industry building, researching and evaluating catastrophe models. He has a specific interest in understanding whether and how climate change is reshaping catastrophe risk, challenging conventional assumptions and developing new approaches to risk assessment. He has been a Visiting Research Fellow at Department of Meteorology at the University of Reading for the past 7 years and is a Fellow of the Royal Meteorological Society.
Those slightly older in the tooth might remember the 2010 hurricane season: the seas were forecast to be warm for the summer, and La Niña was also on the cards. Both came off, but insurers breathed a sigh of relief despite the forecast of a busy season, no hurricanes made landfall. A season like 2010 with 19 storms in the basin – 12 of which that became hurricane-strength – and very low impacts for insurers: are hurricane forecasts useful at all when it comes to insurance losses?
The forecasts for 2010 season were broadly very good: with June’s forecast numbers at 17-20 storms from the (then) five forecasting agencies. Let’s imagine we live in a world where the forecasts for tropical storm numbers in the Atlantic are perfect: the forecast is exactly the same as the activity that season. Would a perfect forecast help in understanding the possible loss outcome?
When it comes to understanding actual losses, we need more than just an active storm in the basin: they clearly need to make landfall in the US to cause losses. Since 1980, we’ve had 612 storms in the basin; 70 of those made landfall at hurricane strength. So, we simulate possible losses for each year since 1980 using the actual historical number of storms in the basin and for each storm in each year, we simulate an 11% percent chance of each storm making landfall. If one of our simulated storms does make landfall, we pick a random landfalling hurricane event from a catastrophe model and use the loss from this event.
For a single simulation of the 44 years from 1980-2024, the below charts show:
For a single simulation of the 44 years from 1980-2024, the below charts show:
Left: The number of tropical storms vs the landfalling hurricanes
Right: The number of tropical storms vs the resultant seasonal losses
From the tropical storms vs. landfalling hurricanes chart on the left, we can clearly see that we’ve imposed a relationship between the tropical storms in the basin with 11% becoming a landfalling hurricane. So broadly, we see that as the number of storms in the basin increase, so do the number of landfalls. It’s not perfect, but there is a relationship. However, the relationship between the number of tropical storms in the basin and the loss at landfall – in the right chart – is much looser than the basin vs landfalling hurricanes statistics.
In our example, even using the actual number of tropical storms each year as if the forecast was perfect, we can’t expect them necessarily to be a strong guide for what losses to expect. Little wonder when looking at the right-hand chart, we can see why people might roll their eyes about hurricane forecast utility for insurers: even our “perfect” hurricane forecasts are seemingly hopeless for predicting losses!
However, we can look at the 1980-2024 simulations in more detail. Let’s repeat the above study. In fact, let’s repeat it a thousand times. The chart below plots all the data, while showing the average annual loss as a function of the number of the storms in the basin: you can hover over the green line to see how the Average Annual Loss moves as a function of the Basin Count.
The chart below plots all the data, while showing the average annual loss as a function of the number of the storms in the basin: if you’re reading this on a web-browser, you can hover over the green line to see how the Average Annual Loss moves as a function of the Basin Count.
Despite all the noise, there is a trend because – at least based on our knowledge of historical data that is imposed in this simulation – 11% of storms that form in the basin make landfall as a Cat 1 hurricane or greater. The more storms in the basin, the more landfalling storms you get, resulting in higher average annual loss. It is also worth pointing out that irrespective of the number of storms in the basin, using the simple 11% landfall rule, you can still zero loss years (the orange dots) if you’re lucky with landfalls.
This type of result is quite common in catastrophe data: a lot of noise, with some underlying trends. As the right-hand previous chart showed, if you pick individual 45-year simulations, you might see a lot of noise: we can see how history is quite adept at hiding trends.
We can take this one step further by comparing the years with 14 storms in the basin – just about average – to the years with 28 storms in the basin – a “hyperactive season” – and contrasting them with histograms of the likely loss:
What is fairly evident is how for the years with 28 named storms, we’re broadly seeing double the chance of losses in the tail. We also note that we can see how the chance of there being NO loss is markedly different – with 19% of years where there are 14 basin-wide storms having zero loss but only a 3% chance when there are 28 named storms.
As we’ve alluded to above, the danger for us however is from drawing conclusions from single years in isolation that may have been unlucky or lucky from a loss standpoint. Let’s say we pick individual years with 14 and 28 storms in the basin at random: it is relatively easy for the quieter 14-storm year to end up with more loss than the 28-storm year. This is because
- Only a certain proportion of storms in the basin will make landfall
- Upon landfall, insurance exposure is quite random, meaning the same strength of storm can lead to anything from millions to tens of billions of loss or more
Interestingly, 30% of the time, a 14-storm season will result in a higher loss than a 28-storm season, which could be a reason why hurricane forecasts are potentially taken with a pinch of salt in our industry. It’s down to the individual whether you see this as simply too much noise to find the information useful.
Very simply: the fewer the data points, the more difficult it is to find a trend, and often in catastrophe modelling, it’s quite necessary to look beyond the historical data (or in this case, simulations of historical data) to be able to understand the issue better.
However, there is an elephant in the room: landfalling behaviour. This example assumes that the chance of a tropical storm making landfall as a hurricane is static. This is an area of research that is fairly sparse in academic literature whilst being fairly core to our understanding of risk, especially in a changing climate.
In a follow-up next month, we will be looking into this topic with Reask, with whom we have entered a multi-year partnership to understand global cyclone risk. Watch this space…
Richard Dixon
Richard has 25 years of experience in the insurance industry building, researching and evaluating catastrophe models. He has a specific interest in understanding whether and how climate change is reshaping catastrophe risk, challenging conventional assumptions and developing new approaches to risk assessment. He has been a Visiting Research Fellow at Department of Meteorology at the University of Reading for the past 7 years and is a Fellow of the Royal Meteorological Society.